Monopoly is a well-known (and, among board game enthusiasts, well-disliked) board game in which players move tokens to buy properties around a board with the hopes of building up their own wealth and destroying that of others. The Australian Monopoly champion Tony Shaw has noted that the game is “just chance”, despite revealing some of his strategies, such as “buy[ing] anything you land on” and that “sometimes you want to stay in jail.” Indeed, Monopoly is not a game without strategy. The ability to convince other players to make (potentially unfair) trades is an integral component of a player’s success in the game. Yet, Monopoly also involves non-obvious strategies whose optimality we can justify mathematically. We will specifically answer the question of how much money a player should allocate towards buying properties. To do so, we begin by using the same model of gameplay as Truman Collins in his in-depth analysis of a wide range of statistics pertaining to Monopoly. Collins divides gameplay into two stages: the earlier property-buying stage in which the properties are not yet mostly owned, and the later property-developing stage during which new property acquisition slows down dramatically, monopolies form, and players build houses and hotels on their properties so that rents are no longer trivial. In the property-buying stage, while a player is not able to choose the properties bought, he or she is nevertheless able to decide how much money to allocate to buying properties. The remaining money, as well as any other profits or losses incurred through gameplay in this stage, is allocated to the development of the player’s properties in the case that the player owns any monopolies.
It is not intuitive why either buying everything or choosing to spend a target amount during the property-buying stage is the better strategy. To even begin to answer this question, we must figure out how to quantify the effectiveness of a given strategy in order to ultimately define what it means for a property-buying strategy (that is, how much money is allocated to buying properties) to be optimal. Even before that, to model the outcome of a given property-buying strategy, I propose a metric called the potential profit (PP) of a set of properties, which, as the terminology suggests, is the approximate monetary gain that the player can expect to receive from the properties during an average property-developing stage in Monopoly. By repurposing mathematician Ervin Rodin’s Trade Index, which is a “a probabilistic model… which can be used to help a player make the proper decisions” with respect to whether or not to carry out a trade, one can estimate the potential profit to be earned from a player’s set of properties at the end of the property-buying stage. In particular, calculating the PP is equivalent to calculating the Trade Index in an instance of a fair trade in which one player will sell all of his or her properties to another player for only cash. For example, if a player has the red monopoly, dark blue monopoly, and $1,000 of cash on hand, then the player’s Trade Index is the sum of the Trade Index of each monopoly. For each monopoly, the Trade Index is given by:
TI = 0.45SE + 0.1K + 0.45C
where, as Rodin explains, SE is a constant corresponding to the relative “expected percentage of dollars returned to dollars invested,” K corresponds to the “kill factor”, which “is a measure of the destroying power of the monopoly which the player seeks to acquire,” and C corresponds to the “cash factor”, which “indicates the extent of the investment as compared to the available money and potential building costs.” The red monopoly contributes 47.3 to the Trade Index, and the dark blue monopoly contributes 57.2, giving a total Trade Index of 104.5. Rodin notes that “one unit on the Trade Index is worth about $31.20,” so the PP for the player’s set of properties is $3,260.
The average of the potential profits over all combinations of properties that a player can buy for a given amount of money is the expected potential profit (EPP). This definition is useful, because it directly relates an amount of money p that a player allocates towards buying properties to a measure of the success of the property-buying strategy. Hence, the optimal amount of money p that a player should allocate to buying properties is the amount of money that maximizes the EPP (that is, the amount of money that maximizes the average PP over all possible combinations of properties that can be bought with $p). Increasing p would give the player more properties, but not necessarily a higher EPP, since with less money available to develop the properties, the cash factor C is low, which drags down the PP and thus the EPP. A computer simulation (which is on my GitHub, but is sloppily written and not documented at all due to the time constraints under which I had to produce the code — sorry!) can be used to determine this optimal amount of money. The simulation uses six simplifying assumptions. First, the player gets the averaged amount of $29.81 every roll from passing Go, Community Chest cards, Chance cards, and the Income and Luxury Taxes. While the player will not actually earn $29.81 from the game alone every round, over sufficiently many rolls, the actual amount that the player will have gained from these squares will approach the average. Second, other players do not hinder the player we are focusing on from acquiring the optimal value of properties in the long run. Third, rent to and from other players in the property-buying stage is low and tends to cancel each other out. The simulation will therefore assume rent paid out to other players has no net effect on a player’s net worth. Fourth, a separate simulation shows that property acquisition slows down dramatically after about 80 dice rolls (80 / n rounds of play in an n-player game) when an average of 24.74 / 28 properties are bought up at that point in the game. Factoring in the first simplifying assumption, the player is now expected to have a net worth of $1,500 + $29.81 × (80 / n). Fifth, to approximate the state of the game at the end of the property-buying stage, we assume that the other players have bought all the remaining properties and model this by splitting the properties randomly between the other players. Finally, single properties are assumed to have a Trade Index of 2. To calculate the Trade Index of single properties, one would take K = C = 0 and SE = 400 × (rent from the property) × (probability of landing on the property in each trip around the board) / (cost of the property). This calculation yields that the most expensive single property, Boardwalk, has a Trade Index of 3.438, and the cheapest, Mediterranean Ave., has a Trade Index of 0.827. Hence, assigning single properties to have a Trade Index of 2 is a reasonable assumption that greatly simplifies the coding process for the simulation.
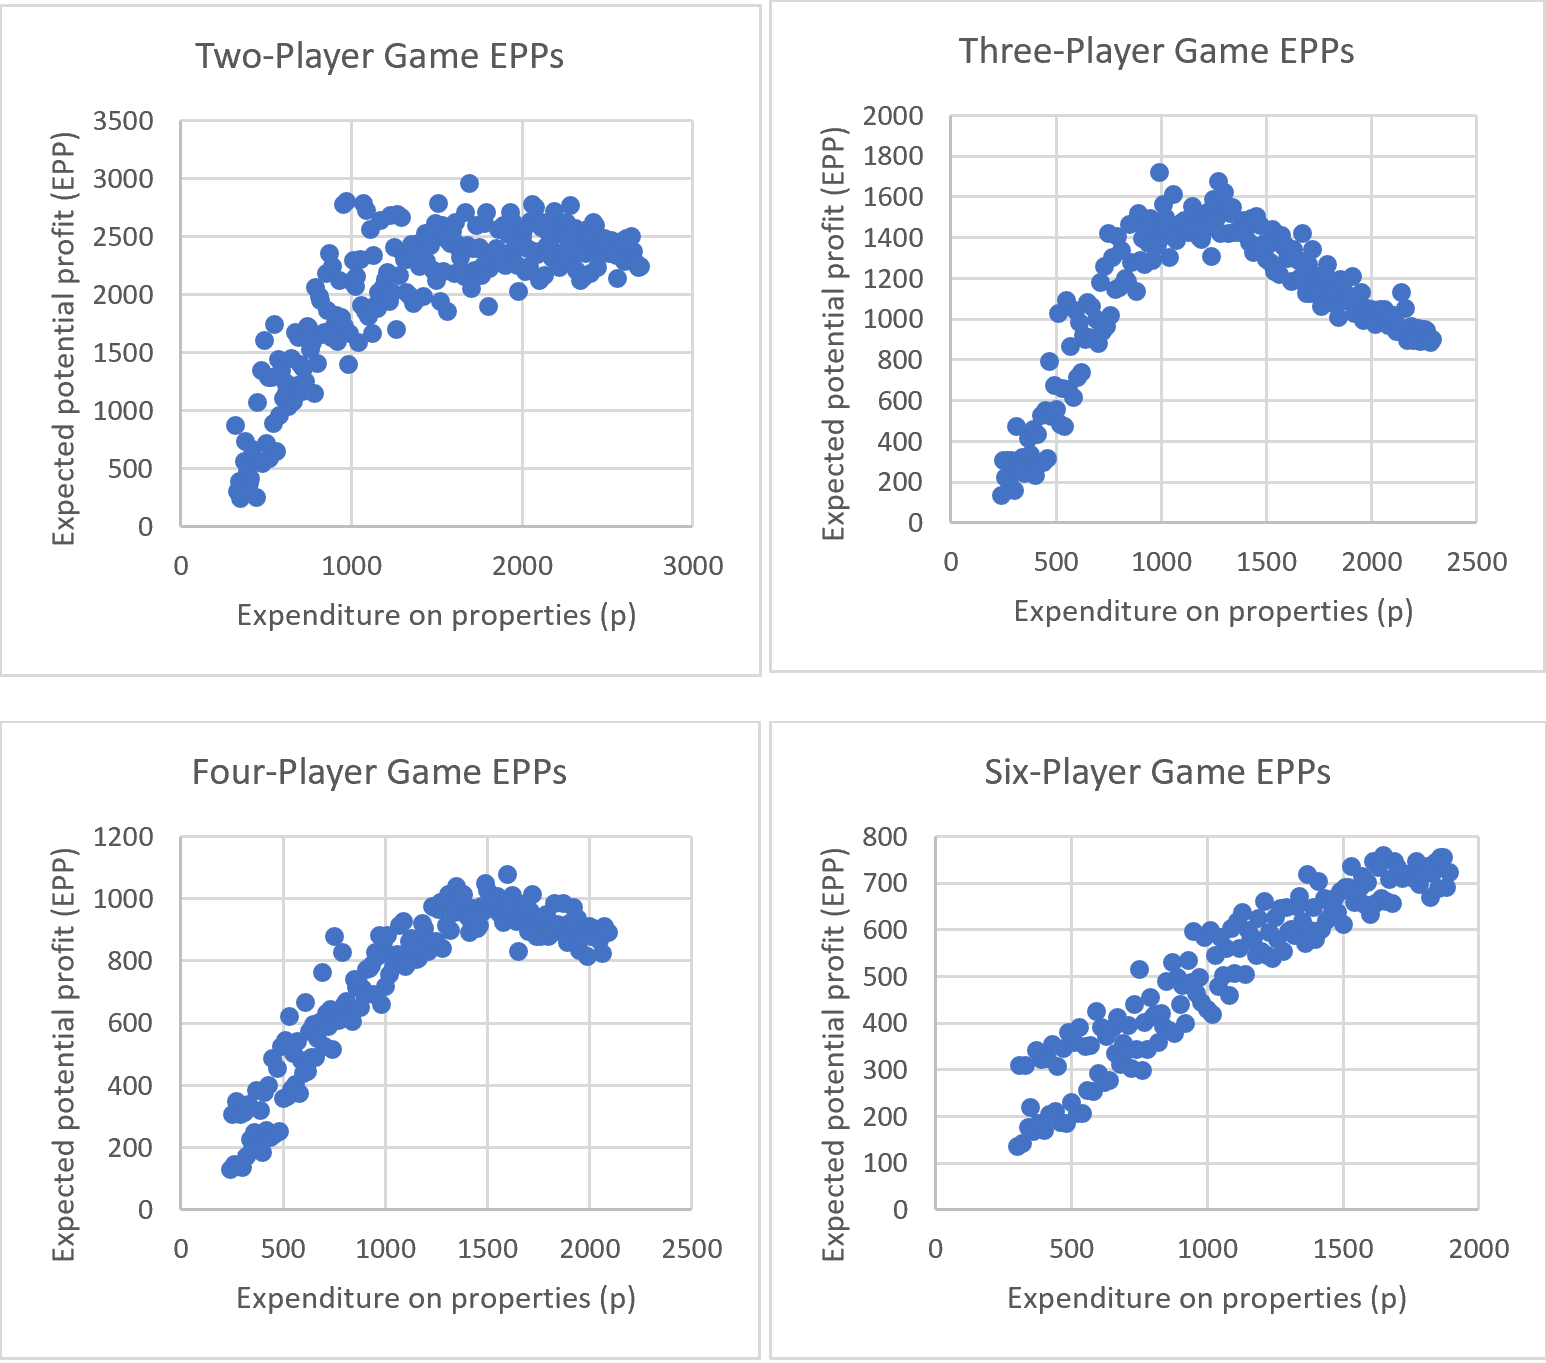
The simulation itself, after the user inputs the number of players in the game, has the player buy a random subset of the properties with total value as close as possible to some amount $p. Then, the player will trade for monopolies whenever a trade can be made with another player that results in monopolies for both players involved in the trade. Since single properties have a far lower Trade Index compared to monopolies, trades that don’t form any monopolies affect the players’ expected potential profit negligibly and can be ignored. Trades that grant only one player a monopoly are not made because, for such a trade to be made fairly, more money would typically need to be exchanged (according to Rodin’s Trade Index) than any player would reasonably have on hand in the property-buying stage of the game. Finally, the simulation calculated and reported the EPP of the player’s properties after buying and trading. The process of starting a new game, buying, trading, and determining the EPP was repeated 50,000 times over a wide range of values for p for two-, three-, four-, and six-player games. Presented below are graphs showing the average EPP for each value for p:

These graphs demonstrate an immensely counterintuitive and unexpected result. In the extreme cases—two- and six-player games—players are playing optimally by spending as much money as possible buying property. However, in a four-player game, spending about three-quarters of a player’s expected net worth (just over $1,500) in the property-buying stage provides an expected advantage of about 15% over Shaw’s buy-everything strategy, and in a three-player game, spending about half of a player’s expected net worth (about $1,150) in the property-buying stage led to an expected advantage of about 60%! A three- or four-player game of Monopoly therefore calls for even more strategy than the negotiation tactics necessary to make trades.
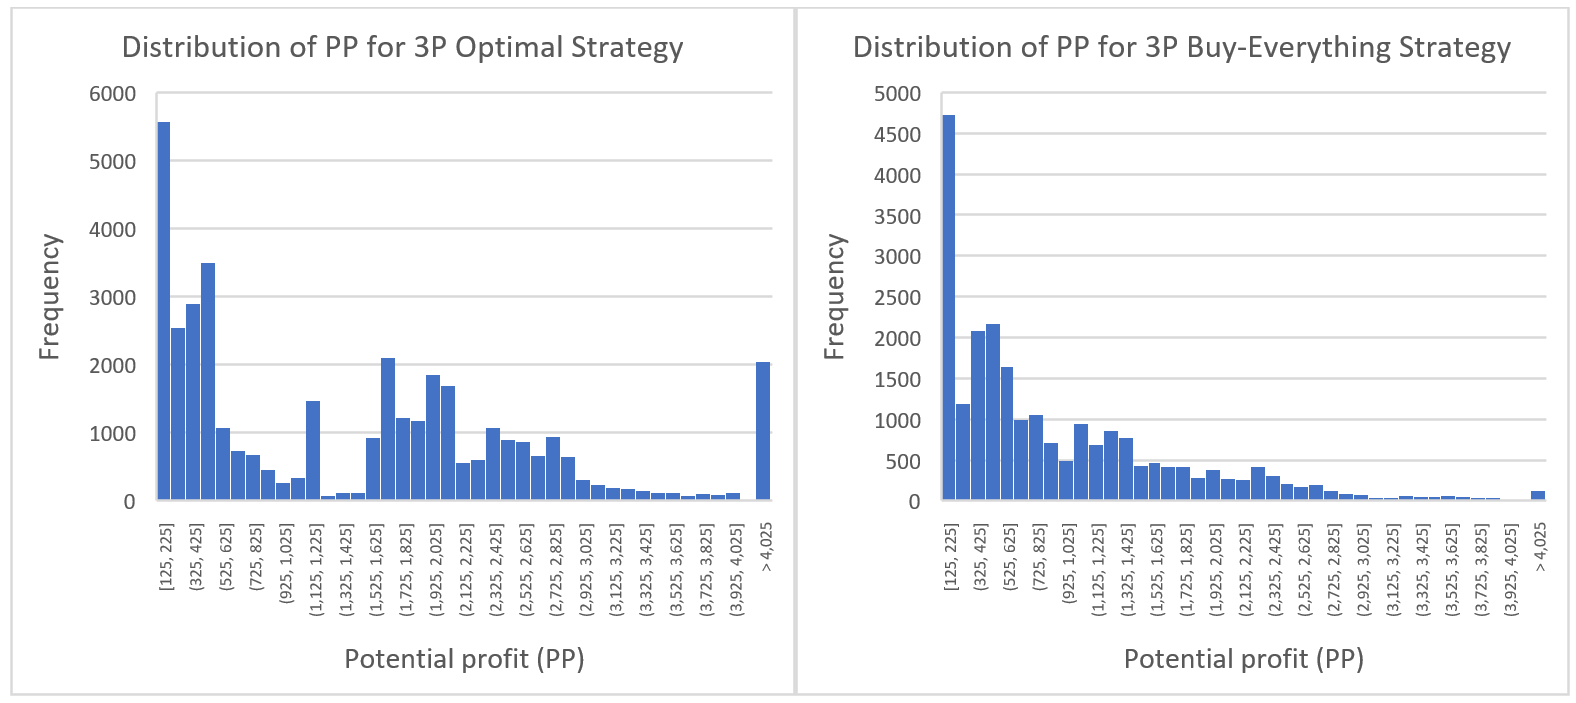
Unfortunately, Shaw’s remark that his victory was “just chance” is also not incorrect. Not even the most strategic three-player Monopoly game is strategic enough to mute the effects of chance. To demonstrate this, we use the same simulation to generate two sets of data: one containing the frequency distribution of the PPs for a player who chooses to spend p = $1,150 ± $100 (the optimal strategy) and another containing the frequency distribution of the PPs for a player who chooses to spend as much as possible (Shaw’s strategy). Here are the results:

The optimal distribution has a mean EEP of $1,485.51 and a standard deviation of $1,288.28, whereas the buy-everything distribution has a mean of $934.97 and a standard deviation of $807.54. Interestingly, these statistics alone are enough to determine how often the buy-everything strategy will beat the optimal strategy. Consider the distribution of how much the optimal strategy will beat the buy-everything strategy by. This distribution will have a mean of $1,485.51 – $934.97 = $550.54 and a far higher standard deviation of $1,520.46. Out of 5,000 random elements in this distribution, 1,904 of them (about 38%) had a negative value (that is, the optimal strategy lost to the buy-everything strategy), and another 50 (1%) had a value of zero (the two strategies tied). Therefore, even with an optimal strategy that improves EPP by an average of 60% compared to the buy-everything strategy, the buy-everything strategy is still expected to tie or beat the optimal strategy about 39% of the time.
I’ll leave it to you to draw conclusions about why board game enthusiasts dislike Monopoly so vehemently.